Fill form to unlock content
Error - something went wrong!
Contact Us
Thank You! We will be in touch.
Implementing Data Analytics in Industrial Machines with Quantiphi and AWS-Native Solutions
By Rajas Walavalkar, Associate Solution Architect, AWS – Quantiphi
By Sanchit Jain, Lead Solution Architect, AWS – Quantiphi
By Matheus Arrais, Sr. Partner Solutions Architect – AWS
 |
| Quantiphi |
 |
Manufacturing companies are one of the largest multipliers of economy, employment providers, and GDP contributors. Due to such a critical position in any country’s economy, maintaining the operational efficiency of manufacturing units is a must.
Machine failures can cause an adverse impact on the operational efficiency of plants and factories, but identification of critical failures and examining physical parameters pose a challenge.
To improve the fault detection process, it’s crucial to monitor production systems and collect performance data in real-time using smart sensors and Internet of Things (IoT) devices.
Traditionally, IoT data was extracted using different licensed software by factory operators and manufacturing companies. This methodology, however, had to stick to limitations of the licensed software that wasn’t scalable with the increase in data volume and restricted customization per the business use cases.
The Amazon Web Services (AWS) cloud-native data pipeline facilitates the convergence of enterprise and operational data for gathering insights that lead to the overall operational efficiency of plants and factories.
This implementation framework provides a way to customize the architecture per the manufacturing factory’s data ingestion mechanism. Also, the cloud-native approach makes it easier to manage and scale the entire implementation when the business grows.
In this post, we will help you to understand the entire workings of this streaming data analytics solution, which helps companies improve the way they analyze different metrics from manufacturing plants.
We’ll highlight the critical aspects of Quantiphi’s serverless, fully-managed, and streaming extract, transform, load (ETL) pipeline, along with the benefits of the centralized lakehouse (data lake + data warehouse) solution built on AWS.
We will also describe how it helped a U.S.-based manufacturing company make better decisions and improve their customer’s production efficiency.
Quantiphi is an AWS Data and Analytics Competency Partner and leading artificial intelligence-first company driven by the desire to solve transformational problems at the heart of the business.
Programmable Logic Controller and Machine Sensor Data
In the manufacturing industry, programmable logic controller (PLC) plays an important role in capturing various data points of the machines and their performance, along with any specific anomalies. PLC is able to control and monitor the input and output of these machines, as well as any changes made to a specific parameter by machine operators.
These machines also have numerous inbuilt sensors which monitor various parameters such as heating, pressure, and number of strokes. Sensors are connected through gateways, which enable them to relay the collected data to a server in the cloud. This data can be further leveraged for an overall analysis of a factory production rate and its efficiency.
Challenges in Proprietary Software
Traditionally, companies have leveraged industrial automation software-based solutions to capture different sensors and PLC data coming from IoT devices in plants, and then define their respective tags to write them to a database. However, the software isn’t customizable to transform the incoming streaming data into different kinds of reports.
Companies require a data analytics platform that can provide easy access to the streaming data and create ad-hoc reports, along with generalized business intelligence (BI) dashboards to understand the production performance.
Quantiphi’s Streaming Data Analytics and BI Platform
Quantiphi’s AWS cloud-native streaming data analytics and BI platform processes the data from IoT sensors to store it in a well-governed data lakehouse architecture. This architecture allows customization per customers’ business needs and opens up the scope to perform machine learning (ML), analytics, and BI use cases.
Quantiphi devises a serverless and fully managed pull-push mechanism to fetch raw data and ingest processed data to Amazon Redshift, a cloud data warehouse system, to provide analytics and visualization capabilities around the sensor data with the best price-performance at any scale.

Figure 1 – Detailed solution architecture.
Ingestion Pipeline (ETL)
- Amazon Simple Storage Service (Amazon S3) is leveraged as the entry point for batch files which provide metadata information about the machines.
- Amazon Kinesis Data Streams is leveraged to obtain the streaming machine and sensor data from factories across different clients’ customers. All of the data obtained from the proprietary software will be streamed to Kinesis using the MQTT broker and Kinesis Producer Library.
- AWS Lambda and AWS Glue jobs are used as consumers of the Kinesis Data Streams and raw CSV files uploaded to Amazon S3 buckets. Lambda polls the data from Kinesis and cleans the data to write the data to an S3 data lake and Redshift warehouse tables.
- For every invocation of the Lambda function, to process the raw data there is a row inserted into the Amazon DynamoDB tables which determines the status of the Lambda functions whether it was successful or a failure.
Data Lake + Data Warehouse (Lakehouse)
- Amazon S3 acts as a storage for all the refined and processed data files pushed from the ETL layer. This refined S3 bucket is partitioned per the use case, and files are stored in snappy Parquet format for making it faster for retrieval.
- AWS Glue Crawlers are leveraged to crawl the enriched data from the refined S3 bucket and to populate the AWS Glue Data Catalog for maintaining a centralized scheme repository for the S3 data lake.
- AWS Lake Formation is used to centrally manage and control the access to the data in the S3 data lake across different groups of users. There are different sets of policies defined for each dataset present in the data lake, which helps in the democratization of the data while accessing Amazon Athena. Thus, the column-level security and row-level security for specific datasets are managed through these policies within Lake Formation for different groups of users
- Amazon Redshift is leveraged as a data warehousing solution that maintains the data from the factories and sensors in facts and dimensions, along with the implementation of SCD Type 2 for maintaining the history of the data.
- Data marts are created which include all of the required calculated KPIs and metrics for the dashboards up to a certain level of aggregation per the dashboarding requirements using materialized views on Redshift. These materialized views are refreshed per the near real-time requirement of the KPIs to be available on the dashboard.
Consumption Layer
- Amazon Athena provides ANSI SQL queries to extract the enriched data from the S3 data lake for any types of ad-hoc requirements or reports. The enablement of Athena provides a way of extracting and transforming the data from the data lake for Excel-based reports.
- Amazon QuickSight is used for visualizing the dashboards from the backend materialized views on Redshift. A different set of dashboards are created per the different personas and are shared with a different group of end users according to their access rights.
- Row-level security datasets are implemented in the QuickSight dataset, which allows only a respective group of users to have access to sensitive information and KPIs presented on the dashboards.
Logging Monitoring and Security Layer
- AWS Key Management Services (AWS KMS) is used to encrypt the data at rest which is stored on the raw and refined S3 buckets, Redshift clusters, Elasticsearch clusters, and Amazon CloudWatch Log Groups.
- Amazon CloudWatch will store the application logs in the respective log groups from the ETL Lambdas and Glue jobs. These logs will be automatically streamed to the OpenSearch clusters.
- Amazon OpenSearch Service is leveraged to query and access the application logs which are streamed from the CloudWatch logs groups to this OpenSearch cluster. The logs obtained in the OpenSearch cluster are used to create OpenSearch monitoring dashboards. Developed dashboards provide real-time metrics on the ETL ingestion pipeline, which can help in the performance tuning of the entire streaming pipeline.
DevOps Implementation
Quantiphi developed the entire solution to provide a near real-time dashboard to continuously monitor and visualize the performance of manufacturing factories for the client’s customer. The solution is built as per the scalability requirement and as a way of providing faster insights to end-users.
The following DevOps practices result in a significant increase in the production releases for the entire ETL pipeline for any new customers:
- Automation of ETL pipeline using CI/CD and CloudFormation templates:
- Quantiphi uses AWS CI/CD pipeline for easy deployment of code present in the AWS CodeCommit repository. The workflow is specified in the form of a release cycle, starting from the DEV, UAT, and finally into the production stage.
- Reusable nested CloudFormation templates are developed to plug in and out resources without many changes in the parent template.
- All of the components which are part of the ETL pipeline are pushed to different environments with proper approval from technical leads.
- Automation of Redshift and QuickSight dashboards using CI/CD and CloudFormation templates:
- The entire creation of the Redshift cluster and warehousing schema designed on the Redshift cluster is completely automated using CloudFormation templates, and by using SQL scripts for the creation of tables on Redshift.
- These SQL scripts include create statements which create the entire warehousing schema and materialized views. SQL scripts are triggered through a custom Lambda function from the CloudFormation template.
- The entire setup of QuickSight dashboards, starting from the creation of data sources, datasets, analysis, and the creation of dashboards, are automated through CloudFormation templates and CI/CD pipeline.
- Use of CI/CD pipeline for the deployment of the latest versions of QuickSight dashboards across different environments provides a better way of handling the changes and incorporating new features in the dashboards.
- Monitoring mechanism:
- A complete configuration monitoring mechanism is implemented with the help of CloudWatch and Amazon Simple Notification Service (Amazon SNS).
- CloudWatch logs are streamed to OpenSearch clusters, which are used to create dashboards developed on these logs to provide real-time insights for monitoring the logs. The dashboards have alerts configured based on the thresholds defined for each log group.
- AWS CloudTrail is enabled to monitor all the API calls done on all the resources configured in the AWS environment.
Customer Use Case: U.S.-Based Manufacturing Company
Quantiphi’s client, a leading global supplier of a two-piece can and end-making machinery, has several customer manufacturing plants which produce cans and specialize in capturing machine sensors and production data in real-time from these plants.
They wanted to have a near real-time analytics platform that could provide insights on machine performance and production efficiency, thereby avoiding machine failure and getting maximum accuracy and efficiency in the production process.
Quantiphi developed a serverless, fully-managed, and streaming ETL pipeline along with a lakehouse solution to enable near real-time analytics on machine sensors and manufacturing factory data for the client.
The single pipeline developed on AWS processes the data to handle both the streaming and batch data files from the client’s customers, and reduced the overhead of writing and maintaining the same transformation logic for both the streaming and batch.
Using Quantiphi’s AWS cloud-native streaming data analytics and BI platform, the client could scale to process the streaming sensor data. This provided an efficient way to generate near real-time insights using QuickSight dashboards, which facilitated better decision making for site operators and factory managers working on the floor within these factories.
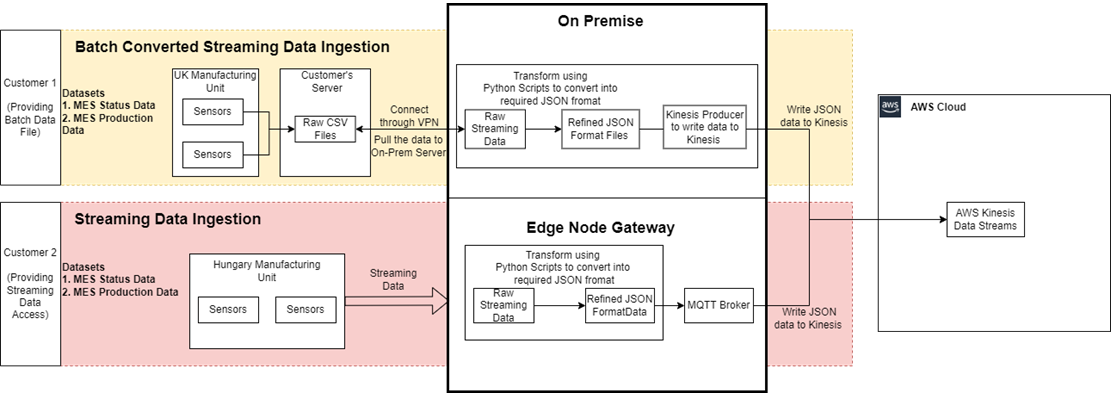
Figure 2 – On premises-to-AWS ingestion pipeline.
The above figure describes how both the streaming and batch data is at the end converted into a single streaming pipeline, and processed as a single source for all the sensors and factory data coming to the AWS platform.
The transformations required before pushing the data to Amazon Kinesis Data Streams include converting the data into a specific JSON format, which won’t change from customer to customer even if there are additions of new machines and sensors.
Summary
Bringing cloud technology into the manufacturing industry can offer unprecedented insight to manufacturers.
Quantiphi’s AWS cloud-native streaming data analytics and BI platform can operate within an intelligent network that monitors machine data to generate near real-time insights, identifies bottlenecks, notifies operators of impending failures, and offers suggestions for next actions based on KPIs.
Its real-time data collection capacity provides a competitive edge to manufacturers by increasing uptime, reducing resource waste, and providing strategic insights that extend beyond maintenance schedules into process optimization.
. .
.
Quantiphi – AWS Partner Spotlight
Quantiphi is an AWS Data and Analytics Competency Partner and leading artificial intelligence-first company driven by the desire to solve transformational problems at the heart of the business.
Contact Quantiphi | Partner Overview | AWS Marketplace
*Already worked with Quantiphi? Rate the Partner
*To review an AWS Partner, you must be a customer that has worked with them directly on a project.